

Despite muted sentiment, the overall market remains balanced. Stock discipline, stable technology pricing and well-defined brand leadership point to a mature market resetting ahead of the seasonal rebound expected in early 2026. December confirmed the stabilisation trend seen throughout Q4, with only limited price shifts across module categories.
TOPCon: bifacial softens, monofacial holds
TOPCon bifacial: €0.088/Wp (–2%) TOPCon monofacial: €0.098/Wp (flat) The slight dip in bifacial pricing reflects typical year-end positioning by manufacturers and distributors. Monofacial modules remain firmly anchored, supported by steady demand and disciplined inventory management.
Full Black: stable premium positioning
Full Black modules: €0.104/Wp (flat) Residential-focused Full Black products continue to command their premium, underscoring their established role as a design-driven, value-added segment rather than a price-led one.
Back Contact: marginal correction, growing relevance
Back Contact (BC): €0.100/Wp (–1%) Back Contact modules saw a modest correction in December. While still a niche compared to TOPCon, BC technology continues to gain visibility and transactional relevance, closing the year as a clear emerging benchmark in high-efficiency segments.
PERC: stability persists
PERC: €0.077/Wp (flat) PERC prices held steady for another month, reinforcing their position as a mature, fully commoditised technology with minimal volatility.
Module brand rankings remain unchanged, reflecting consistent channel strength and availability:
1. Longi
2. Jinko
3. Trina
4. JA Solar
5. Canadian Solar
The absence of reshuffling highlights a market where brand trust, logistics reliability, and portfolio depth outweigh short-term price incentives.
sun.store
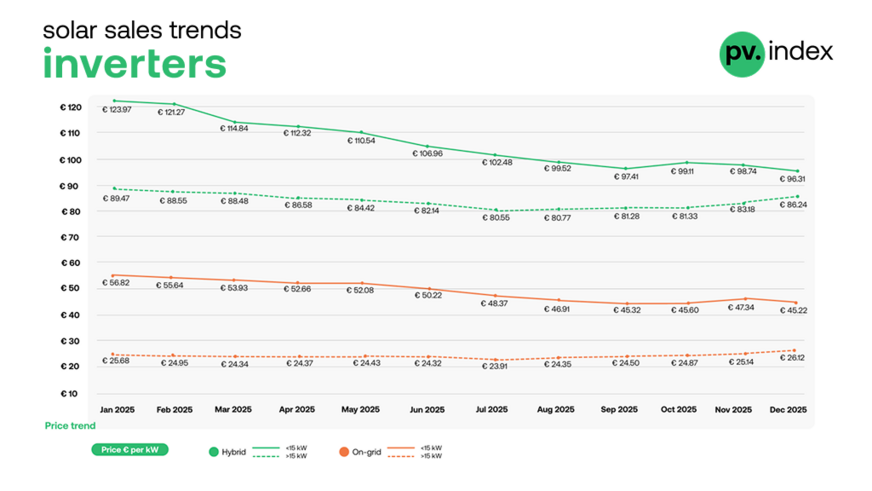
Inverter market: residential softness, commercial resilience
Inverter pricing diverged across power classes in December, reflecting contrasting demand dynamics at year-end.
Hybrid inverters
1–15 kW: €96.31/kW (–2%)
15 kW: €86.24/kW (+4%)
Smaller hybrid systems softened as residential installations slowed, while larger commercial hybrids saw renewed pricing strength, buoyed by project completions and year-end procurement.
String inverters
1–15 kW: €45.22/kW (–4%)
15 kW: €26.12/kW (+4%)
The residential string segment experienced the sharpest correction this month, whereas higher-capacity systems benefited from stable commercial and industrial demand.
Inverter brand rankings: selective shifts across segments
Hybrid inverters
1. Deye
2. Sungrow
3. Huawei
4. GoodWe
5. Fronius
String inverters
1. Huawei
2. Sungrow
3. SolarEdge
4. Fronius
5. SMA
The rankings reveal a clear split: strong competition and rotation among hybrids, while leadership in string inverters remains anchored with established global players.
sun.store
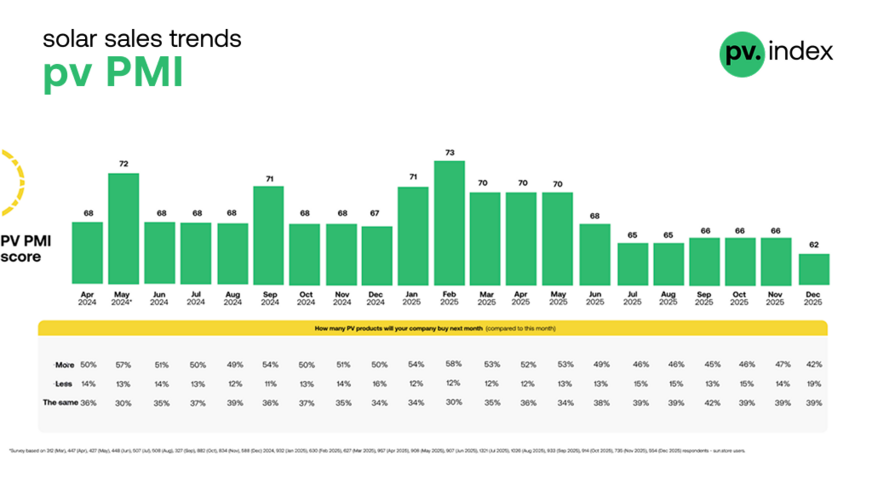
PV PMI: sentiment reaches a cyclical low
In December, the PV PMI dropped to just under 62 points—its lowest in pv.index history. The previous minimum was 65, making this decline notable, though not unexpected. This drop reflects: seasonal slowdown in installations, year-end budget exhaustion, cautious procurement ahead of Q1. While January–February typically bring a seasonal rebound, the market will enter 2026 from a PMI level around five points lower year-on-year, indicating a more conservative starting point than last winter.
Europe races to secure supply as China ends export incentives
2025 yearly review: a market that normalised
2025 marked the transition of the European PV market from correction to normalisation. Volatility gave way to discipline and price wars were replaced by technology-driven competition.
The three phases of 2025
Q1 – Recovery and optimism: Strong PMI readings reflected confidence that the post-2024 price correction had bottomed out.
Q2 – Stabilisation: Prices levelled off, inventories normalised and purchasing became increasingly selective.
Q3–Q4 – Maturity and discipline: Summer weakness gave way to a steady, execution-focused market defined by controlled stock levels and limited volatility.
Technology evolution
PERC: fully commoditised, stable throughout the year
TOPCon: established itself as the undisputed market standard
Back Contact: emerged as a credible next-generation efficiency benchmark
Summary – what 2025 means for 2026
Price stability is likely to persist, with volatility limited to specific segments Technology differentiation will matter more than headline pricing Strong brands with reliable channels and balanced portfolios are best positioned to lead.
Modules: broadly stable, with selective year-end declines; BC ends the year as a rising efficiency benchmark Inverters: residential softness contrasts with strength in larger systems.
Rankings: leadership remains stable across both modules and inverters.
PMI: hits a historical low, signalling a seasonal pause rather than market stress As 2025 concludes, the European PV market stands not at a turning point, but at a reset—stable, disciplined, and preparing for a measured start to 2026.
Stay informed – subscribe to our newsletters
About – pv.index & The PV Purchasing Managers' Index (PV PMI)
pv.index tracks monthly trading prices for solar components on sun.store, Europe’s largest B2B marketplace for PV equipment. Pricing data is weighted by transaction power, providing a true market reflection.
Brand rankings are based on total sales value on sun.store between January and October 2025, identifying the most in-demand brands in each category. Rankings are updated monthly to reflect current buyer preferences and market conditions.
The PV PMI gauges purchasing sentiment among verified sun.store users. It is calculated using the formula: PMI = (P1 × 1) + (P2 × 0.5) + (P3 × 0), where P1 = % expecting improvement, P2 = % expecting no change, and P3 = % expecting decline. A score above 50 signals a positive market outlook. (hcn)