



How much do solar and wind actually earn when they sell their power? The capture rate answers that question by comparing the average price a technology receives with the average day-ahead price across all hours. Starting with this edition, pv Europe will publish the index once a quarter for the 12 Nordic price zones in Norway, Sweden, Denmark and Finland, using public data from ENTSO-E. This first index covers the 12 months from November 2025 to October 2026.
The figures for West Denmark (DK1) show how this works in practice. Over the year, the average day-ahead price there was €108 per MWh, but solar output fetched only €76.5 per MWh on the same market. Solar farms all produce in the same sunny hours, and that is exactly when prices fall. Since €76.5 is 71 percent of €108, solar’s capture rate in DK1 was 71 percent. The figure matters for any solar power purchase agreement priced on a pay-as-produced basis, because the buyer takes the power in the hours the plant generates, which are rarely the average hours of the day.
In Amsterdam, RE-Source 2026 catches the PPA market mid-rethink
Solar and wind, zone by zone
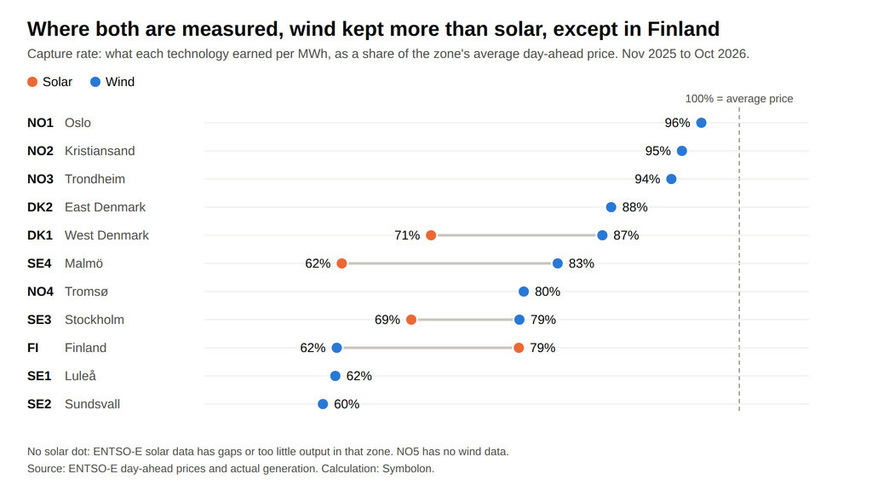
ENTSO-E has a full year of solar data for four of the 12 Nordic zones. Across those four, solar’s capture rate ranged from 62 percent in southern Sweden (SE4) to 79 percent in Finland, with central Sweden (SE3) at 69 percent and DK1, as shown above, at 71 percent.
Wind could be measured in 11 zones, where its capture rate ranged from 60 to 96 percent. It did best in southern and central Norway (NO1 to NO3), earning 94 to 96 percent of the average price, followed by the two Danish zones at 87 to 88 percent, SE4 at 83 percent and SE3 at 79 percent. In DK1, SE3 and SE4, that put wind between 10 and 21 percentage points ahead of solar. The lowest rates were in northern Sweden (SE1 and SE2) and Finland, where wind earned 60 to 62 percent of the average price.
Higher prices, fewer negative hours
Day-ahead prices rose in every zone compared with the previous 12 months (November 2024 to October 2025). In DK1 and DK2, the average climbed by about a third, to €108 and €110 per MWh. Prices in SE3 and SE4 rose by almost half, to €68 and €89 per MWh, and in Finland by 35 percent, to €55 per MWh. Some zones started from a very low base: NO3 went from €16 to €78 per MWh, and SE2 from €14 to €42 per MWh.
October was especially expensive. DK1 averaged €160 per MWh, its highest monthly price since December 2022. At the same time, hours with negative prices became less common. Ten of the 12 zones had fewer than in the previous year: in Finland, they fell from 490 hours to 80, in SE2 from 716 to 196 and in DK1 from 451 to 208. NO2 and NO4 bucked the trend, with negative hours rising to 55 and 191 respectively.
ENTSO-E/Symbolon
Why Finland is different
Of the four zones where the two can be compared, Finland is the only one where solar earned a bigger share of the average price than wind, at 79 percent compared with 62 percent. The main reason is the sheer amount of wind power in the Finnish system. Over the year, wind farms produced 21.9 TWh, while solar produced just 1.7 TWh. When the wind blows across the country, prices drop, which is exactly when the wind farms are producing most. As a result, wind’s monthly capture rate in Finland never rose above 74 percent and fell as low as 54 percent.
How buyers get a 15-year PPA past the C-suite

Symbolon
Within individual months, solar generally produced at the right times. It earned more than the monthly average price in eight of the 12 months, and in both January and October its capture rate reached 141 percent. Over the year as a whole, however, the timing worked against it. Solar delivered 77 percent of its annual output between April and August, when power averaged €41 per MWh, compared with €55 per MWh for the full year, and in July the average was just €15 per MWh. January and February, when prices averaged €117 and €137 per MWh, brought only 44 GWh of solar between them.
Finland’s 79 percent combines both effects: good timing within each month, but most of the output in the cheapest months of the year. Anyone valuing Finnish solar has to price the season as well as the hour. The next index, due in January, will cover the darkest months of the Nordic year, when solar output is at its lowest.
How the numbers are made
Prices are ENTSO-E day-ahead prices, and output is ENTSO-E actual generation for solar and for onshore and offshore wind. The capture price weights each 15-minute price by the output in that period. In DK2, SE1, SE2 and the Norwegian zones, ENTSO-E’s solar data is missing or incomplete, so these zones are excluded from the solar figures. A negative hour is an hour with a day-ahead price below zero, and since prices moved to 15-minute steps in October 2025, each negative 15-minute period counts as a quarter of an hour. (Oscar Weber/hcn)
Monthly figures for all 12 zones are available from Symbolon