In August, module prices moved in different directions, reflecting uneven availability and selective procurement across the market. The main takeaways:
● Monofacial N‑type modules rose by one percent, reaching an average of €0.096/Wp. The small uptick points to steady demand in premium segments.
● Monofacial P‑type modules dropped sharply by six percent, sliding to €0.079/Wp. This reflects sustained price pressure on the technology in its phase‑out stage, currently sold as value‑oriented stock.
● Bifacial N‑type modules continued to soften, falling by two percent to €0.097/Wp.
● Full Black modules recorded the steepest decline, down five percent to €0.099/Wp after a surge in July. This reflects the overall drop in demand for residential installations across Europe, partly driven by the holiday season. Despite these movements, the brand rankings remained stable, with the same five manufacturers occupying the top positions:
The top 5 solar panel brands in August 2025 were Jinko, LONGi, JA Solar, Trina and Aiko.
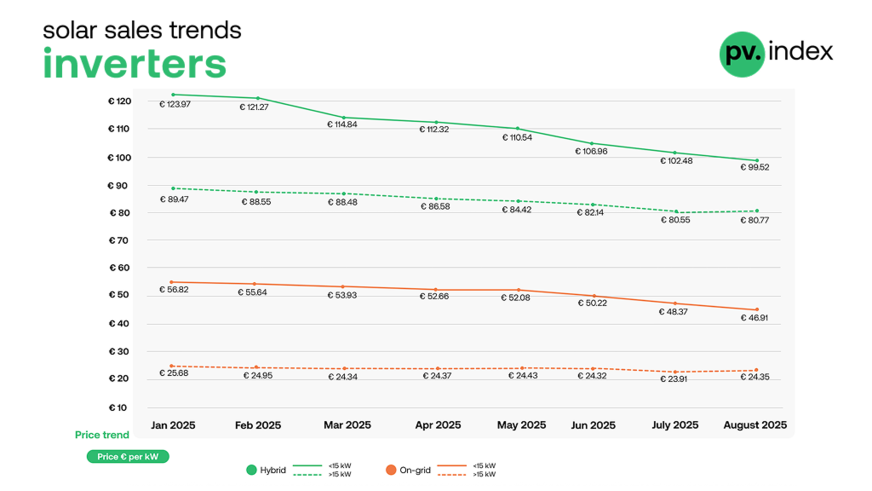
Inverter market: string vs hybrid trends
Competition in the inverter segment remained intense in August, and the divergence in price trends between residential and C&I markets has become pronounced. Since the beginning of the year, residential hybrid inverters have fallen in value by more than 20 percent, compared with a decline of less than 10 percent in the C&I segment. Similarly, residential string inverters have lost nearly 20 percent of their value since January, while prices for C&I inverters have stayed relatively stable.
EU solar stalls as residential rooftop and PPAs segments falter
Hybrid inverters
● Systems below 15 kW fell by three percent, averaging €99.52/kW.
● Larger systems above 15 kW remained unchanged at €80.77/kW, indicating price stabilisation at higher capacities.
String inverters
● Units under 15 kW declined by three percent, reaching €46.91/kW.
● Larger systems above 15 kW edged up by two percent to €24.35/kW, reflecting firm demand in the commercial segment.
sun.store
The inverter rankings remained largely consistent in August, with only small shifts underscoring ongoing competition. Huawei continues to dominate the string inverter category, keeping the top spot for several months in a row. Its strong market share reflects both brand recognition and installer confidence in warranty support and delivery times.
Next investor newsletter: Cybersecurity risks mount for PV
Sungrow and SMA follow closely, maintaining steady positions on the back of strong demand in commercial projects, while SolarEdge and Solis complete the top five, with Solis consolidating its presence among cost‑sensitive buyers.
In the hybrid inverter market, Deye retains a clear lead, supported by its balance of affordability and performance. Huawei is climbing steadily in this category as well, strengthening its cross‑segment presence, while GoodWe and Sungrow remain strong contenders in mid‑sized residential and C&I systems. Fronius, though still within the top five, recorded slightly reduced trading activity in August, reflecting continued supply limitations. Taken together, these rankings illustrate a market where Huawei’s dual strength across both hybrid and string categories sets it apart, while other brands compete on availability, pricing and feature sets to defend their positions.
The top 5 string inverter brands in August 2025 were Huawei, Sungrow, SMA, SolarEdge and Solis.
The top 5 hybrid inverter brands in August 2025 were Deye, Huawei, GoodWe, Sungrow and Fronius.
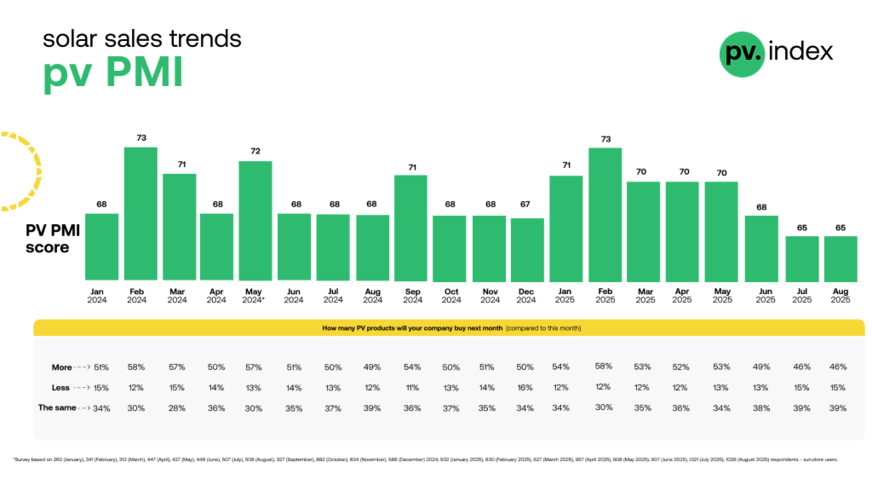
PV PMI: sentiment holds steady
The PV PMI held at 65 in August, unchanged from July and confirming historically low sentiment. Among 1,321 surveyed sun.store users:
● 46% plan to increase purchases
● 39% expect to keep procurement levels stable
● 15% anticipate reducing their buying
This static result suggests that installers and distributors remain in “wait‑and‑see” mode. Seasonality is a major factor, as August traditionally slows due to vacations and extreme temperatures across Europe, but structural issues such as financing constraints and uncertainty over future pricing also play a role.
sun.store
“Summer is always a quieter period for our industry, but the difference this year is the depth of hesitation. Installers are preparing for autumn, holding back on major commitments until they see clearer price signals and stronger customer demand,” commented Krzysztof Rejek, VP of Sales at sun.store.
UK households increasingly see cost benefits of solar
Looking ahead – September as turning point
With summer now behind, the sector is preparing for renewed momentum in September. Procurement strategies are expected to become more active as project pipelines refill, although uncertainty around upstream supply dynamics remains. Should Chinese production adjustments and policy changes affect polysilicon and wafer prices in Q4, Europe may face renewed upward pressure on component costs. For now, the market continues to be defined by competitive pricing, careful inventory management and cautious optimism for the months ahead.
About pv.index and PV PMI
pv.index tracks monthly trading prices for solar components on sun.store, Europe’s largest B2B marketplace for PV equipment. Pricing data is weighted by transaction volume, providing a representative view of the market. Brand rankings are based on total sales value on sun.store between January and July 2025, identifying the most in‑demand brands in each category. Rankings are updated monthly to reflect current buyer preferences and market conditions.
The PV PMI measures purchasing sentiment among verified sun.store users. It is calculated as PMI = (P1 × 1) + (P2 × 0.5) + (P3 × 0), where P1 represents the percentage expecting improvement, P2 the percentage expecting no change and P3 the percentage expecting decline. A score above 50 indicates a positive market outlook. (hcn)