Module prices declined slightly.
● Monofacial N-type: average market price reached €0.097/Wp, reflecting a 3% decrease month-on-month
● Monofacial P-type: dropped by 3% to €0.083/Wp
● Bifacial N-type: fell by 3% to €0.101/Wp
● Full Black modules saw a moderate 1% decline
Despite the moderate drop in prices, a major shake-up occurred in brand rankings. For the first time this year, Trina Solar claimed the top position among solar panel brands, thanks to improved availability of residential models across Europe:
Top 5 solar panel brands – June 2025
- Trina (up from 4th)
- Jinko
- JA Solar
- LONGi
- Aiko
“We’ve observed shifting preferences due to stock availability and delivery times. Trina's supply chain responsiveness in Europe appears to have made a difference this month.” said Filip Kierzkowski, Head of Partnerships and Trading at sun.store.
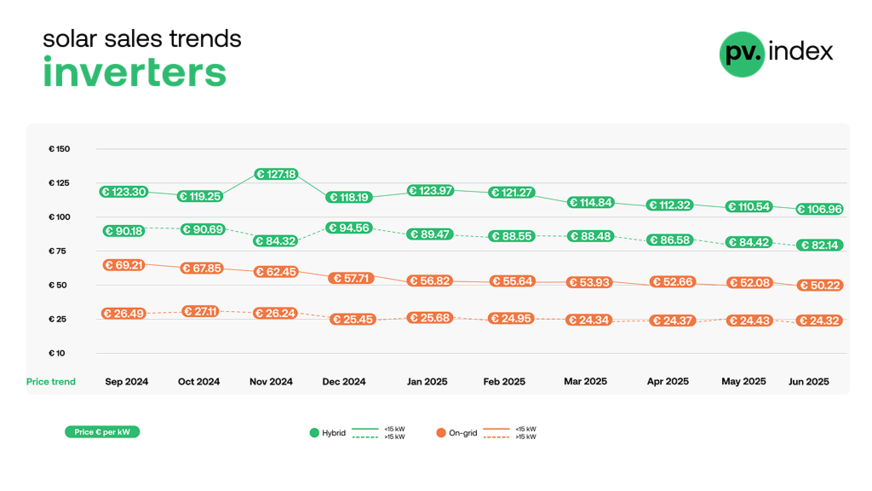
Inverters
● Inverter prices continued to decline slightly in most segments:
● Hybrid <15kW: down by 3% to €106.96/kW>15kW: dropped to €82.14/kW, also a 3% decrease
● On-grid <15kW: fell by 4% to €50.22/Wp>15kW: held steady at €24.32/Wp
sun.store
Top 5 hybrid inverter brands – June 2025
- Deye (consistent leader)
- Huawei (up from 3rd, boosted by the new MAP0 model)
- Sungrow
- GoodWe
- Fronius
Top 5 on-grid inverter brands – June 2025
- Huawei (still #1)
- SMA (strong growth, back in 2nd for third month running)
- Sungrow (remains in the top tier since January)
- SolarEdge
- Fronius
Battery pricing & brand trends
For the first time, the June 2025 PV Index included detailed insights into battery storage trends, offering a clear view of pricing and brand performance across the European market. Based on sales data from January to June 2025, this section highlights two distinct segments within the battery category:
● Performance Line: systems with an average price below €250/kWh, including popular brands such as Deye, Dyness, Growatt, and Pylontech.
● Premium Line: premium solutions priced above €250/kWh, represented by brands like BYD, Huawei, SolarEdge, and Sungrow. This segmentation allows to reflect actual market dynamics more accurately, without skewing average prices due to differing product tiers.
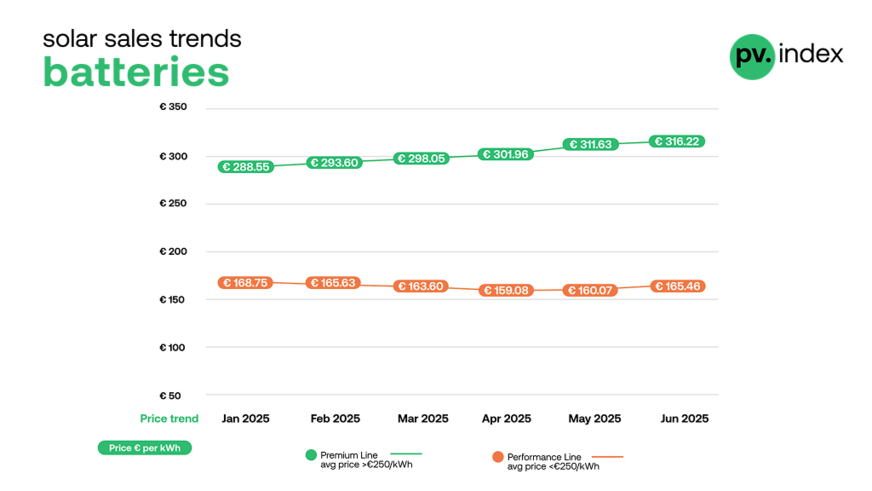
Battery prices
Performance Line: Prices for mid-range battery systems remained relatively stable in the first half of the year. After a slight downward trend in Q1 – reaching a low of €159.1/kWh in April – prices began rising again in May and June. By June 2025, the average price had returned to €165.5/kWh, marking a 3% month-over-month increase. This rebound reflects healthier demand and narrowing stock levels following last year’s oversupply.
Expert analysis: What market turbulence means for PV and storage
Premium Line: Premium battery models saw a steady price climb throughout the first half of the year. From €288.6/kWh in January, the average price increased almost every month, landing at €316.2/kWh in June. The 1% rise in June continues this upward trajectory, pointing to stable demand for high-quality storage solutions across residential and commercial segments.
sun.store
Top 5 battery brands – June 2025
- Huawei - now leading the segment after a steady climb
- Dyness - previously the frontrunner, now in 2nd position
- Deye - consistently strong among performance brands
- Sungrow - maintaining a presence in both premium and hybrid categories
- Pylontech - reliable and accessible option for installers
“Demand remains solid, but availability now plays a larger role in determining monthly rankings. Dyness, for example, remains highly popular, but limited stock may have impacted June sales,” said Filip Kierzkowski, Head of Partnerships and Trading at sun.store.
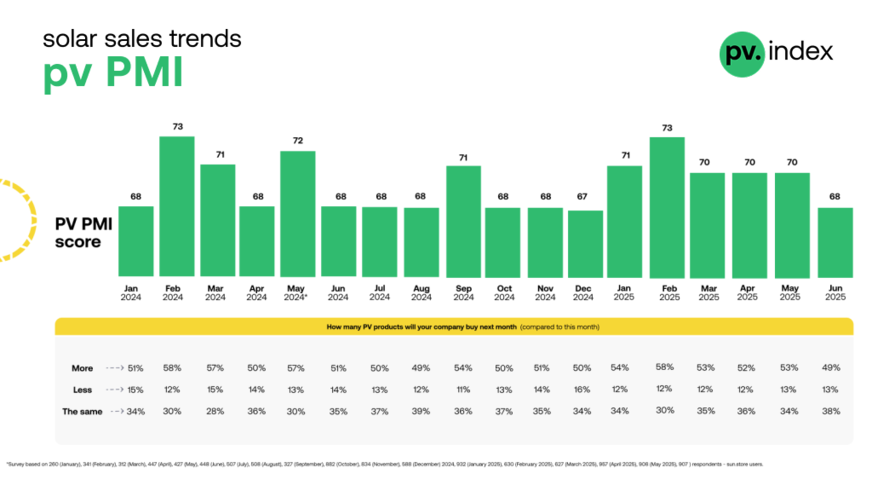
PV PMI: Sentiment softens slightly
The PV Purchasing Managers' Index (PMI) dipped slightly to 68 in June, down from 70 in May, reflecting cautious optimism amid mid-year market adjustments. Out of 908 sun.store users surveyed:
● 49% plan to increase purchases
● 38% will maintain current levels
● 13% expect to reduce ordersThe market continues to show resilience, driven by EU renewable targets and residential interest, but buyers are taking a more measured approach amid ongoing grid delays, price sensitivity and macroeconomic uncertainty
sun.store
Outlook: What to expect in Q3
With H1 behind us, market participants are adjusting to the new rhythm of 2025: stable but selective growth, cautious restocking, and a more strategic approach to procurement. Panel prices are softening, inverter deals remain attractive, and batteries – though stabilizing in price – show clear segmentation between value and premium tiers. As competition intensifies and summer installations peak, staying ahead means acting on fresh, verified data.
About PV Index and PV PMI
PV Index tracks monthly trading prices for solar components, based on data from sun.store, a online PV trading platform with over 8.9 GW of components available. Prices are weighted by transaction power to provide a reliable market estimate.
CEO of sun.store: “We provide real-time availability”
The Top 5 rankings below are based on sales value data from the sun.store platform, collected between January and May 2025. These rankings reflect sun.store’s own transaction data. The five best-selling brands by transaction value were identified in three categories: solar panels, hybrid inverters and on-grid inverters. Sun.store monitors the PV market closely and will update these rankings regularly to reflect the latest trends.
The PV PMI gauges demand sentiment in the solar industry, with scores above 50 indicating expansion. It is calculated from a sample of more than 900 sun.store buyers and provides a snapshot of purchasing intentions across Europe.
The PV PMI was calculated as: PMI = (P1 * 1) + (P2 * 0.5) + (P3 * 0), where: P1 = percentage of answers reporting an improvement, P2 = percentage of answers reporting no change, P3 = percentage of answers reporting a deterioration. The survey is based on a sample of 950+ sun.store buyers. (hcn)